 Coinspeak Technical and Fundamental Market Analysis

In the post we’ll review trends and targets for BTC and ETH.
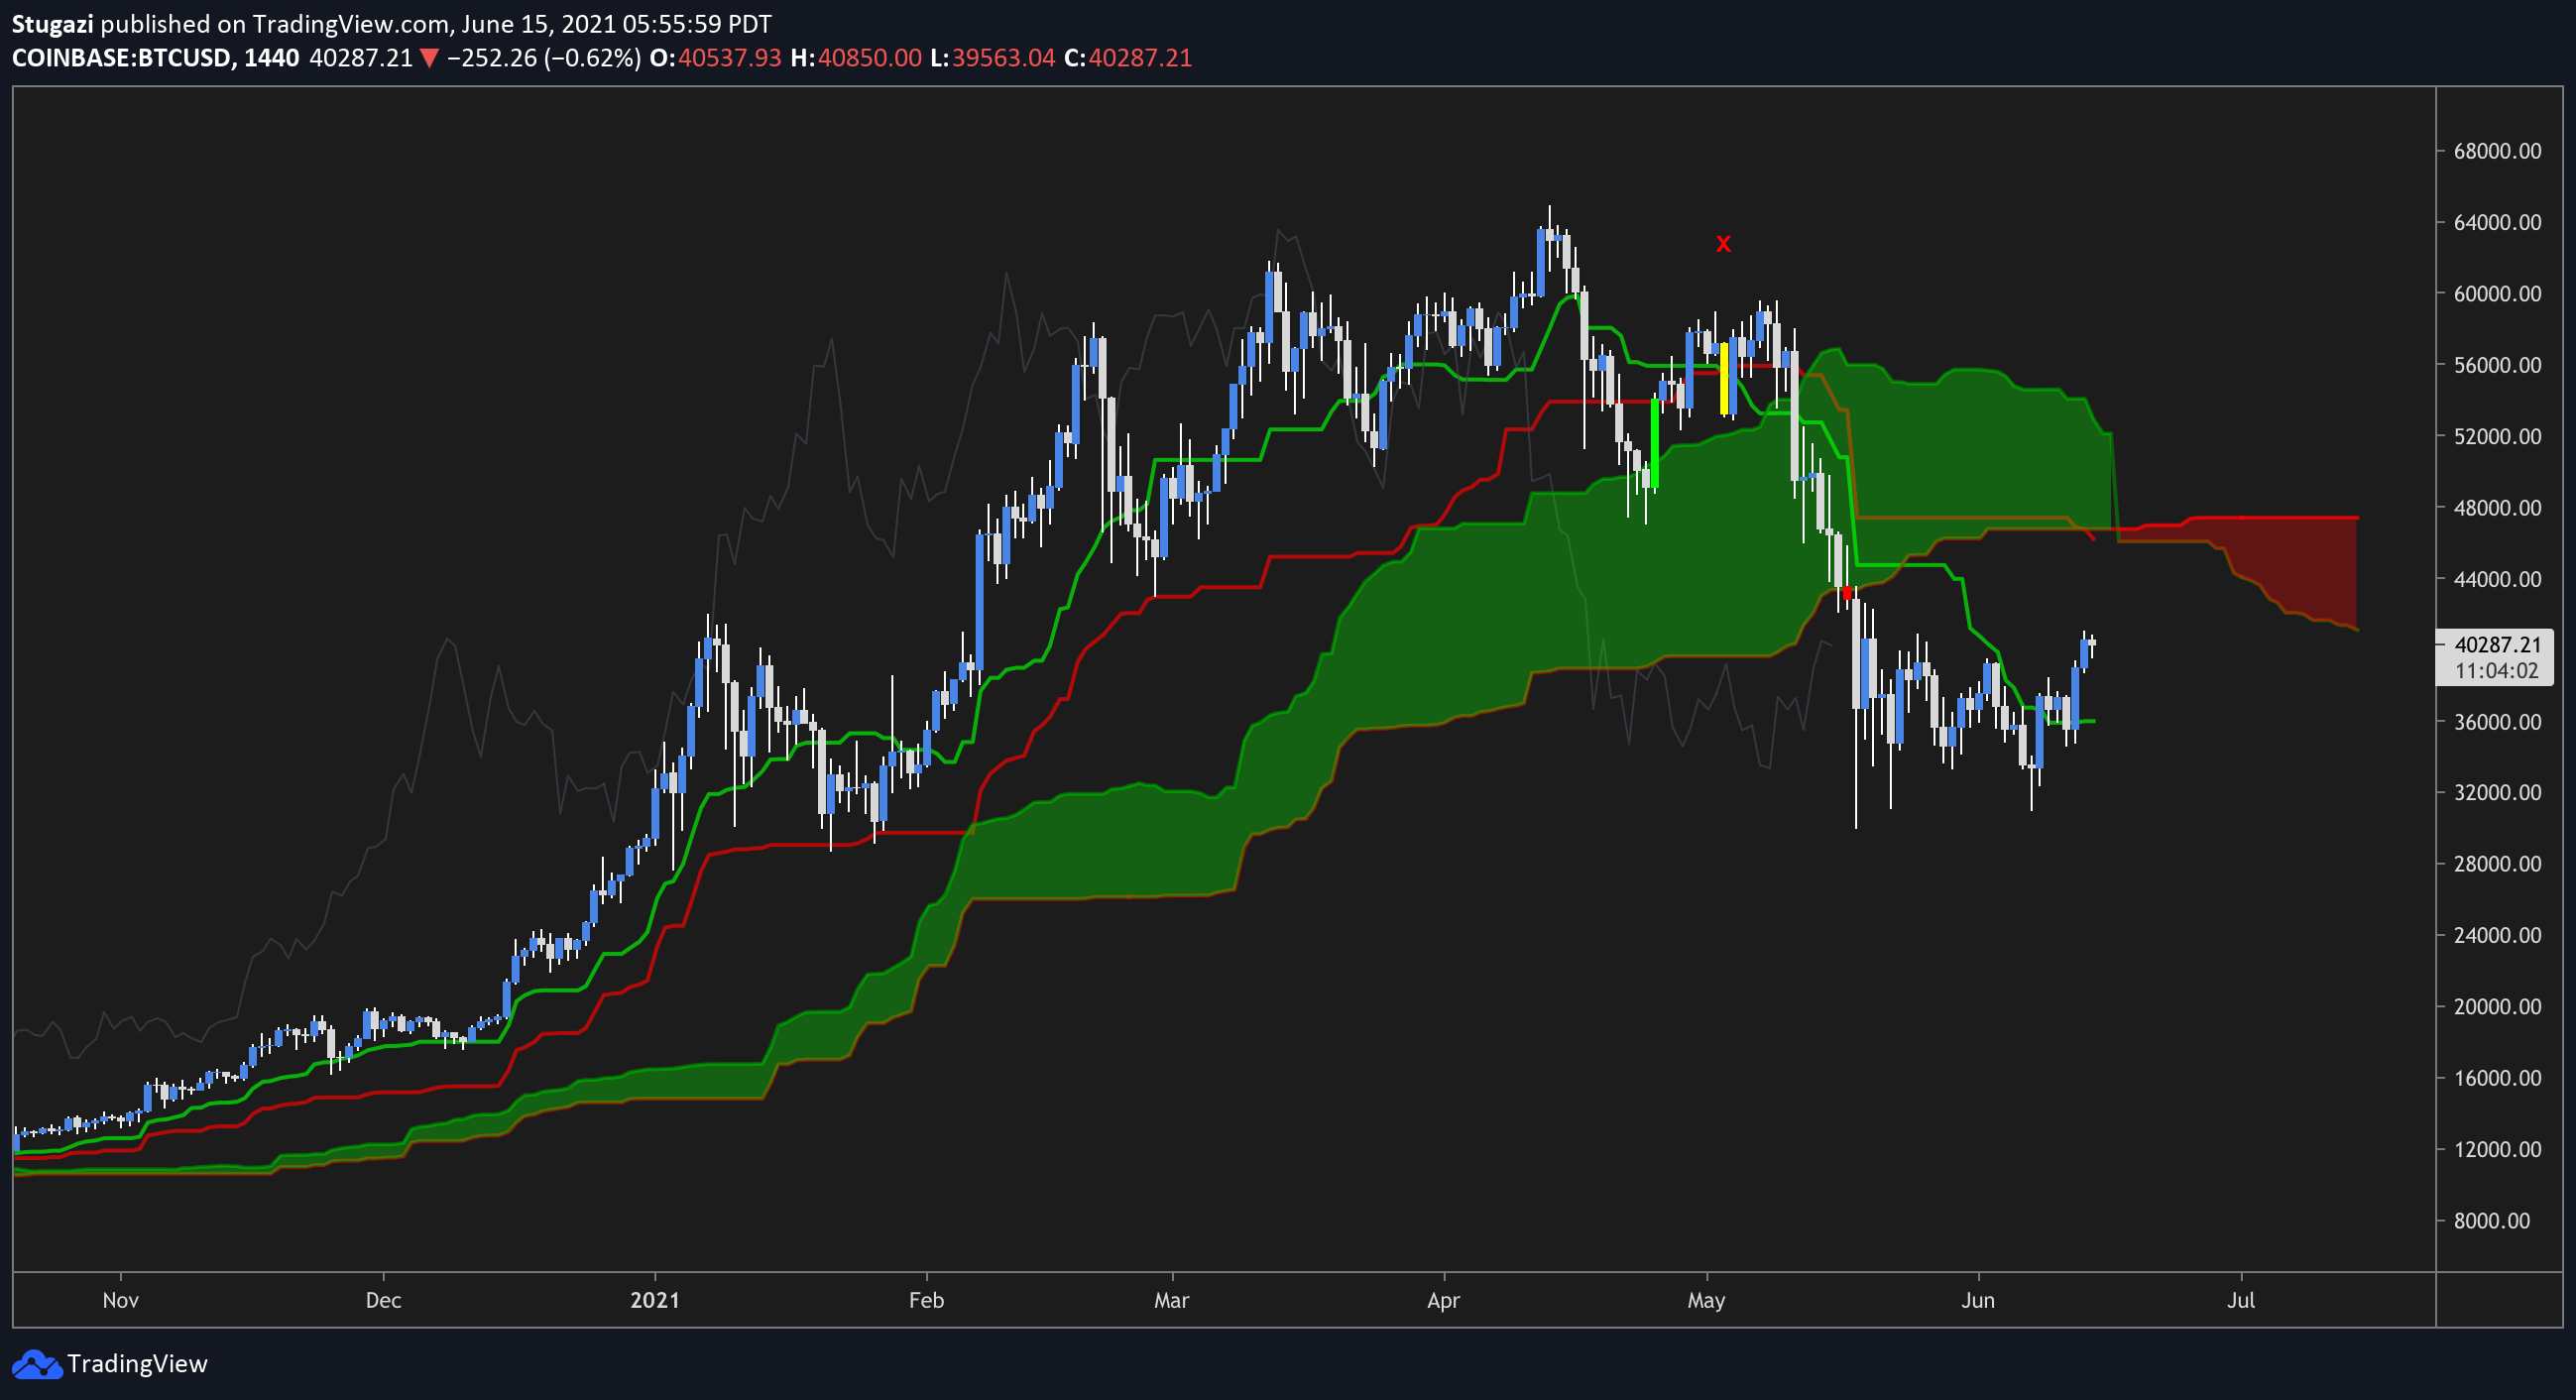
BTC daily cloud below. There were several notable moments on this chart: when price broke below Kijun (red line) around 56k, when price closed inside cloud around 50k and finally when price went below cloud around 42k. All of those signals were tradable. Behind the paywall I’ll show you how my system called the trend reversal at 52k and provided accurate targets for the bear move.
Currently, price below cloud and sideways between 30 and 40k. Trade the range, the breakout or both.
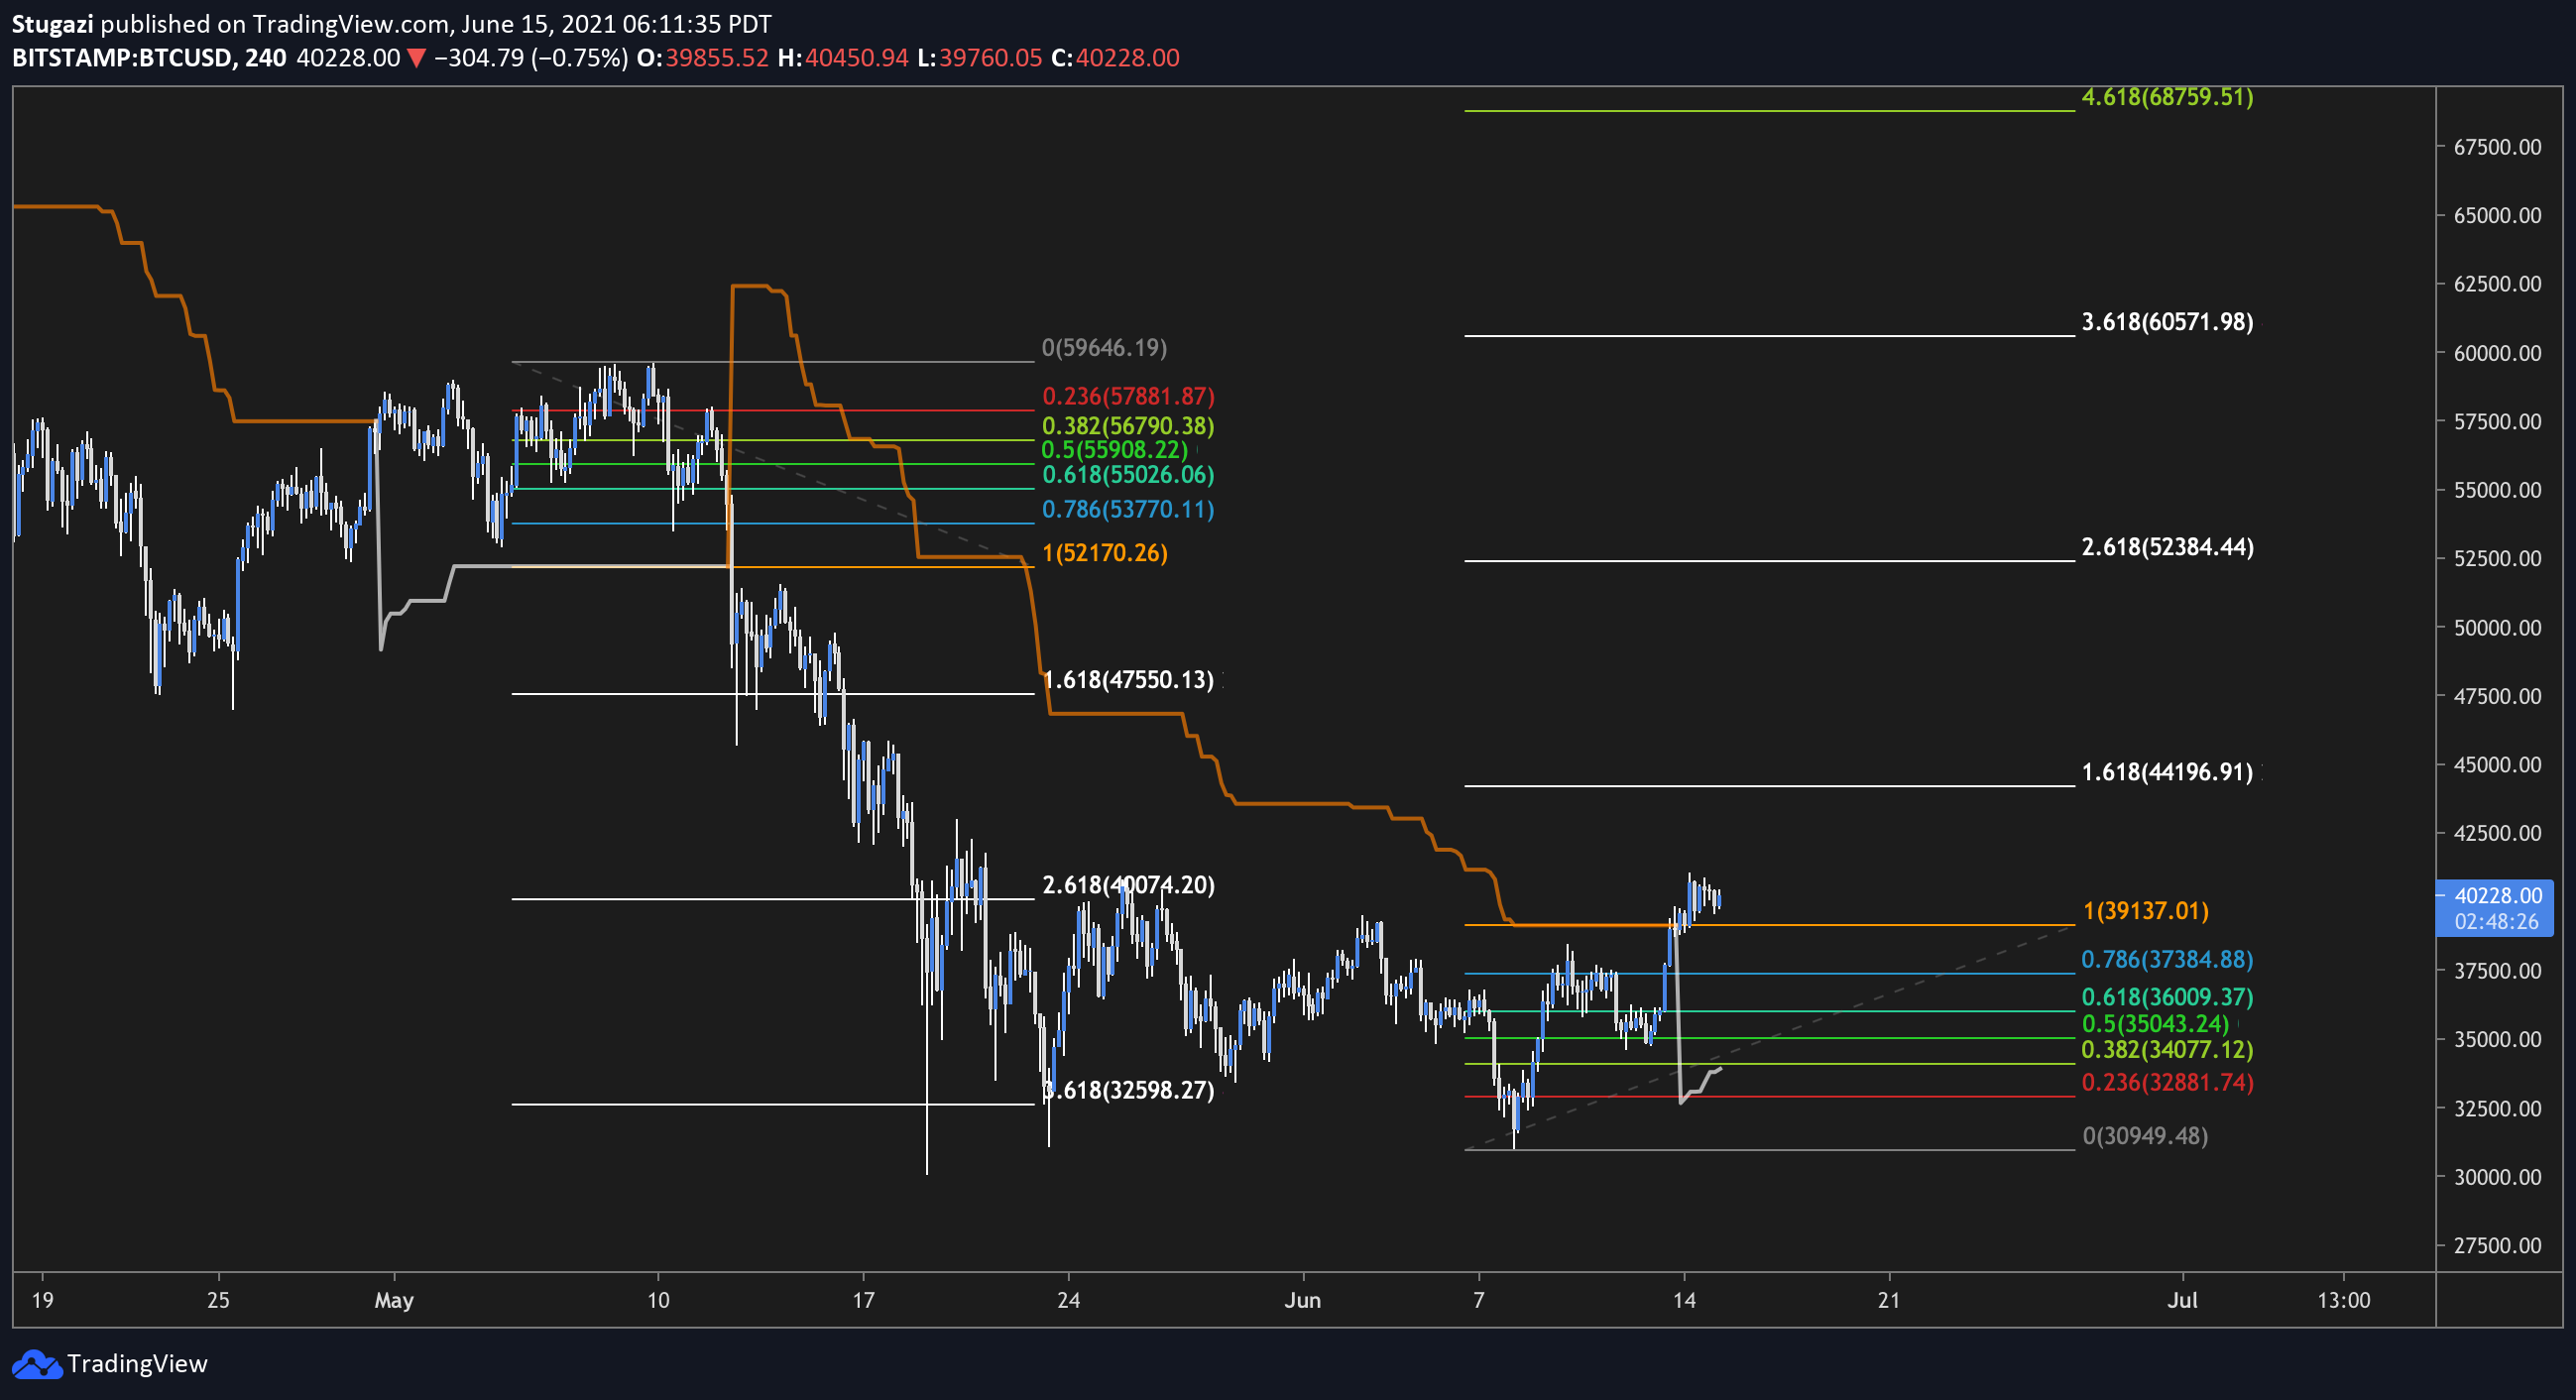
On a shorter timeframe, BTC 4H cloud shows a breakout around 37k. Watch the 40k area.


The chart below has a Supertrend indicator with custom settings plus fibs. This system is very simple. Above the white line is bullish trend. Below the orange line is bearish trend. When the trend flips find the high (or low) and draw a fib to the trendline. It doesn’t get any easier. Targets for that trend are the white lines (the golden ratio fibs). 3.618 is usually the area the trend is exhausted and retraces and/or reverses. In cases where 4.168 level is reached we zoom out to daily chart and draw a new fib.
As you can see starting on the left the bullish trend failed (this happens) but then the fib nailed the targets for the bearish trend.
At ~39k BTC flipped the trend bullish. I’d like to see that pivot high around 41k broken for confirmation to add confidence to the targets in white. Many people are watching these targets. This doesn’t make them bad targets! Good systems should agree on targets.
That’s the technical take. My personal bias is that BTC will struggle around 40k and be sideways between 30 and 40k until the El Salvador situation is clearer. There is always a ton of FUD and the possibility of a Tether pump. There are many ways to play this chart, including doing nothing till the move is confirmed. A lot of traders feel compelled to trade every day. If the price is going to 60k who cares about a move between 38k and 41k?
I tweeted out a month ago that I felt ETH was now leading the market and the coin to watch for direction. While BTC has bounced off 29k to signal some bullish life ETH is still in bear mode under $2,800.
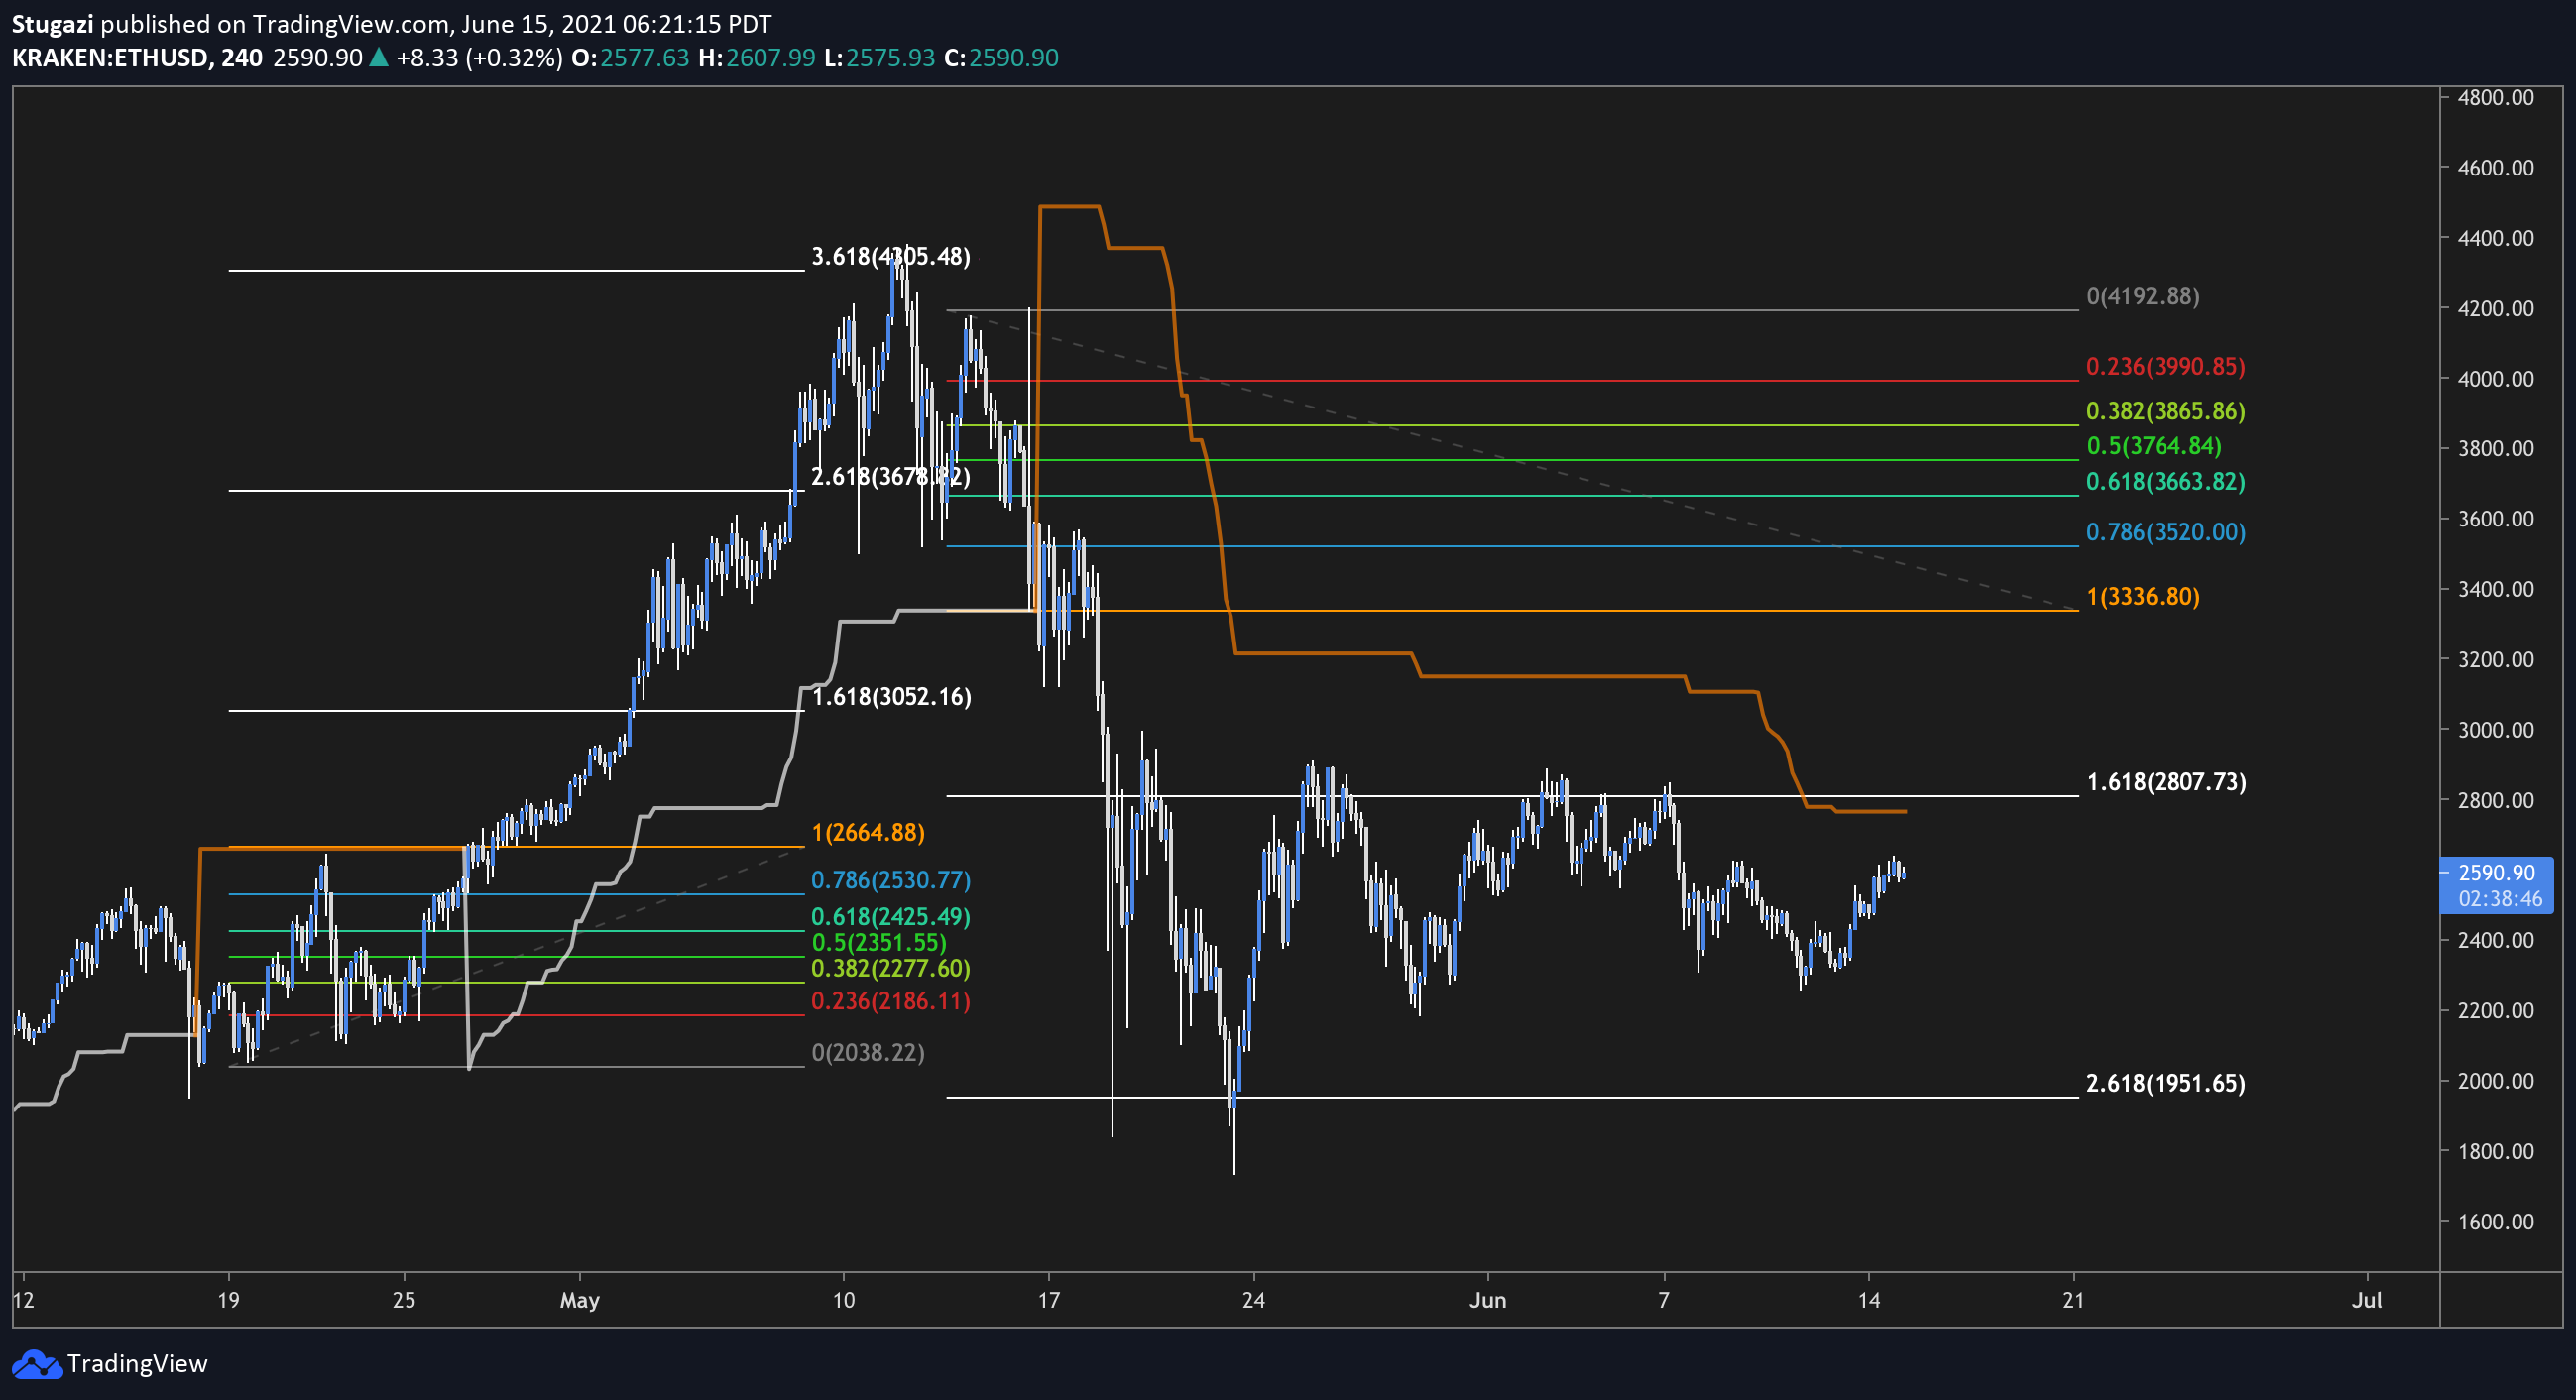
On the left of this chart you can see how the model nailed the top on ETH. The Supertrend is drawn by tradingview. All that’s left to do is apply the Fibs as I outlined above and use the white lines as targets. Currently this chart indicates ETH is sideways in the bear trend and must close above $2,800 to reverse trend. As price has failed to do this several times I’d need to see confirmation above $2,800 for 24+ hours to have confidence this trend is tradeable.
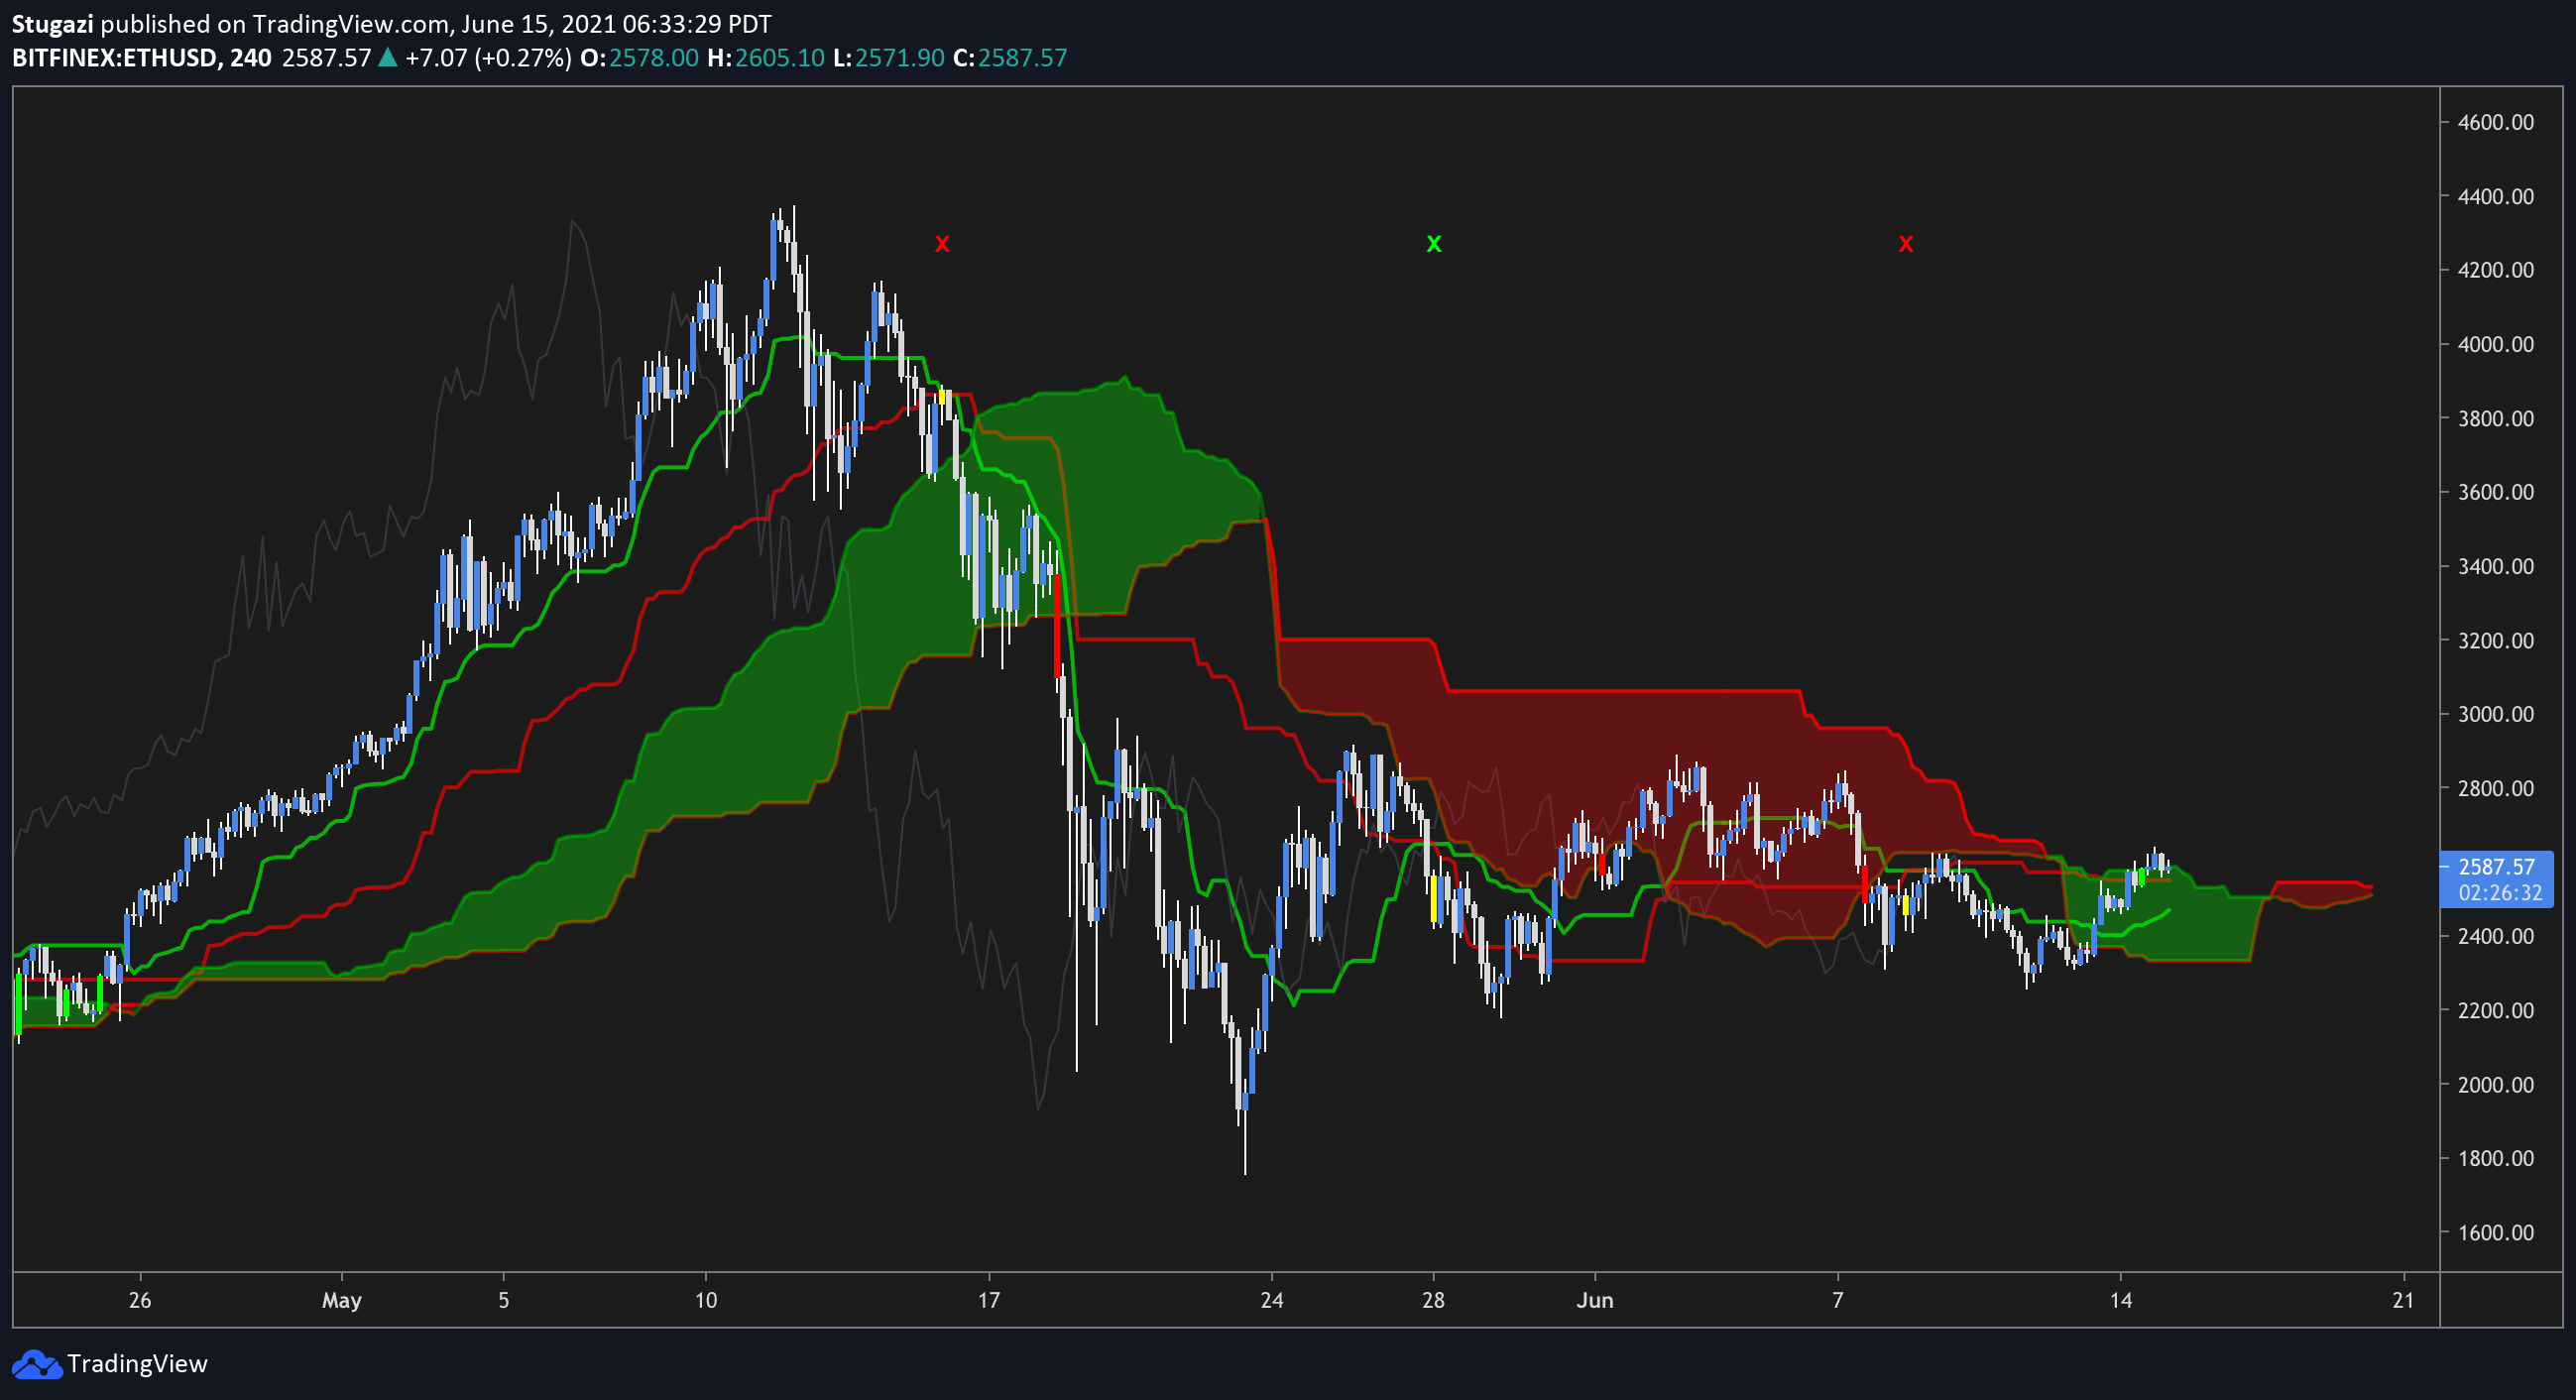
Checking the cloud chart on ETH below we see ETH’s sideways price action more clearly. Price is barely above cloud while cloud is twisting red. Lot of mixed signals. I read this as confirmation of what I said above. I’d like to see ETH above $2,800 for 24 hours for confirmation. After all, if ETH is going to $10k why rush? (spoiler alert, it’s not going to $10k).
My personal bias is that the market is exhausted. There will be a bigger bear market ahead however I will let the charts guide and update my opinion on a daily basis. The trend is our friend!