 Coinspeak Technical and Fundamental Market Analysis

The SP500, aka the SPY, has been on a tear since the low of $2,200 on March 23rd. To the disbelief of many, the market has been on a V shaped recovery so far.
As I am a primarily a trend trader and use the Ichimoku Cloud as my primary technical trend indicator I noticed today that the SPY had a bearish TK cross on June 23rd. This occurs when the fast moving tenkan crosses under the slower moving kijun on the Ichimoku cloud.
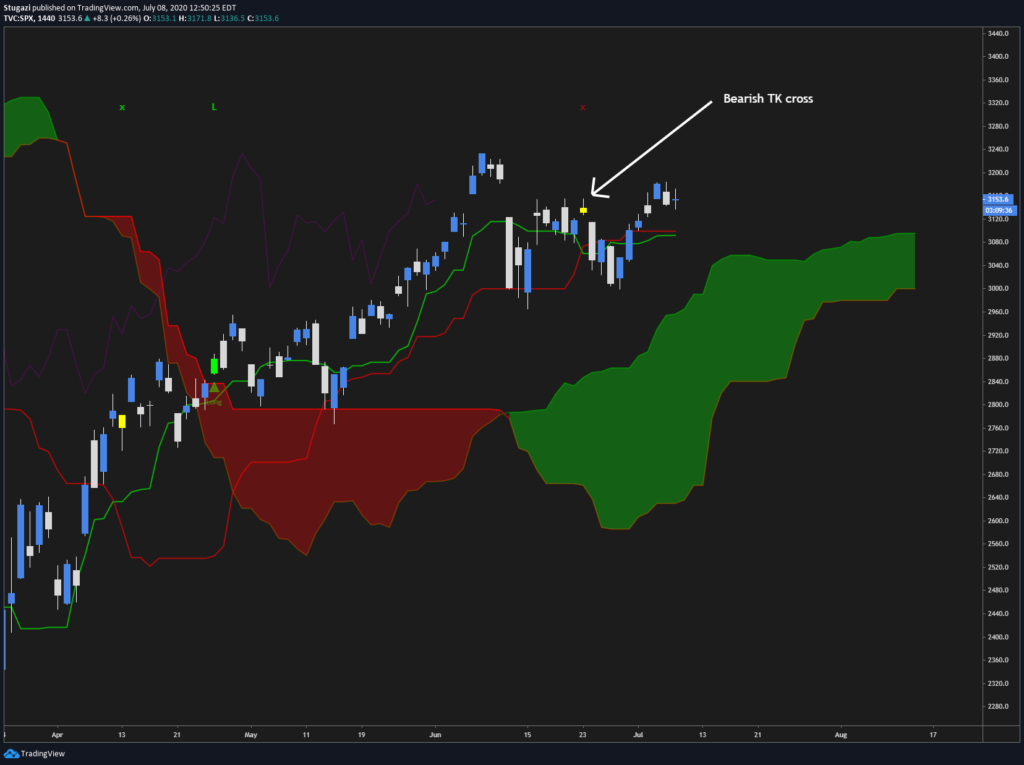
If you don’t know TA jargon, it’s OK. This early signal could be reversed with another move higher which would signal bullish continuation but if it continues downward we may have the beginning of the exhaustion of this record setting rally.
What’s important here is to notice when strong trends falter. Is this a hiccup for the bulls or the beginning of a bearish trend?
I have no position in SPY but if I were long I would sell 25% of my position on this cross as a defensive measure and move my stop loss for the rest to the bottom of the Cloud (~$3,000).
This Index signal coincides with many new all time highs for individual stocks. However, as I run through my stock screens I also see many double and triple tops and other less visible stocks showing more bearish indications.
This is not a call for end of the rally but it is something to notice and track.
It’s difficult to keep a level head when markets are gaining 13% per month. This pace is not normal or sustainable. Keep an eye on the trend.


One comment
Pingback: Count Your Blessings - Coinspeak